Simulation Visualizations
Thermal Sensitivity of Voigt Profile Fit Parameters
These gif figures were generated by H. Hiss using the THERMAL simulation suite and were presented in Hiss et al. (2019;arXiv/1903.11940). In this work we studied how to constrain the thermal state of the gas in the intergalactic medium using the analysis of HI absorption features in quasar spectra. These absorption features are parameterized using a Voigt profile defined by two parameters b and NHI. The images show the change of shape of the b-NHI distribution when changing the thermal state of the intergalactic medium, described by the temperature at mean density, T0, and the slope of temperature-density relation, γ (go to our about section for some more information about these parameters). They show that increasing log T0 shifts the distribution toward higher b. and that increasing γ mainly tilts the distribution at log (NHI) > 13 cm-2 . In both figures the concentric rings on the top right represents the KDE bandwidth chosen (1, 2, and 3σ). We refer to H. Hiss's work for more details on how these figures were done.
- The change of shape of the b-NHI distribution when changing the temperature at mean density, T0 [gif]
- The change of shape of the b-NHI distribution when changing the slope of the temperature-density relation, gamma [gif]
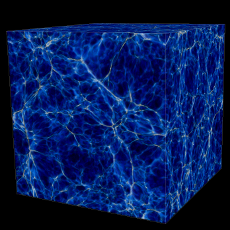
Simulation Fly-by videos
These movies show simple fly-by volume rendering videos of different 3D fields of one of the fiducial simulation in the THERMAL Suite ~2.1 Gigayears after the Big Bang (z=3). At this redshift the simulated volume shown in all movies is 7.453 Megaparsec3. All movies were produced using VisIt visualization analysis tool. Credit for these visualizations is: J. Oñorbe (IfA).
- Gas Density: Projected gas density, cale goes from black (low) to white (high) trough blue [avi][mov]
- Gas Density: Ray casting, [avi][mov]
- Temperature: Ray casting, [avi][mov]
- Neutral Hydrogen Density: Ray casting, [avi][mov]
- Lyman-α Optical depth: Ray casting, [avi][mov]
- 3 panels: Gas Density, Temperature and Lyman-α Optical depth (heavy) [avi][mov][gif, smaller file, lower quality]
Do not hesitate to contact us if you have any questions or queries.